There are so many previews available for big games and so many of them don't tell me what I want to know. What I want to know is actual keys to winning. Do you stop Lebron James' drives to the rim or do you stay on the shooters? Do you take away Steph Curry or Klay Thompson or KD or Draymond? Can you possibly take away all the weapons in this series?
The answer to the last question, by the way, is, "No, you can't." As I'll get to, the balance among the offensive options in this series is outstanding. As good as the Warriors' defense has been in the playoffs (and regular season), it is hard to see how they can take away the options that the Cavs have. As much as the Cavs have improved their D in the playoffs and were able to pressure the Warriors last year, this Warriors team has a healthy Kevin Durant that makes it tougher to just take away the perimeter threats.
My goal isn't to really make a prediction here, but one that I will make is that this will be an offensively driven series. I expect offensive efficiencies in the 112 points/100 possessions range. I only set it that low because the refs often let 'em play in the Finals. Last year's Finals had an average efficiency of about 108 and these offenses are far better.
How much better? The Warriors are clearly way up from their injury-impacted 2016 run. (By the way, we all should be rooting for a healthy Finals because both teams had injury excuses the last two years.) In 2016, the Warriors' offensive efficiency in the playoffs before the Finals was about 111; this year, it's about 118. In 2016, the Cavs' offensive efficiency pre-Finals was an amazing 118; this year, it's 122. The only team that keeps these two from having the highest playoffs efficiency in my database is the 2005 Phoenix Suns - and that's because the Warriors and Cavs this year both played so much garbage time that they didn't have to play as hard offensively as those Suns did. If you ditch all those meaningless minutes, the Warriors' offense goes to 120 pts/100 possessions and the Cavs' jump to 124.
That is historical. Or history. Or post-historical. Feel free to come up with your own cliche. (Or if you just can't be creative, feel free to look here for some of everyone's favorite overused phrases.)
About one or two teams a year post that kind of efficiency over 12 games, almost all against mere mortal teams, not against playoff teams.
What makes these teams so hard to stop is that their threats are diverse in terms of personnel and in terms of floor spacing. It helps to have such unselfish players to take advantage of that spacing.
When I say unselfish, I mean that the two biggest stars in this series - Lebron and Steph - aren't even the most important scorers to stop on their respective teams. Instead it's Kyrie and Klay (which doesn't have the same ring) that are the guys most important to limit. Both of these guys shoot an effective 62% in good offensive games and just 47% in bad ones and shoot about 30% of the team's shots. Lebron and Steph score but also free up their teammates to such an extent that you can't focus all your defensive gameplan on stopping their shots. You may focus on Kyrie over Richard Jefferson, but I can tell you that you can't ignore Jefferson. You as a fan may not even know who Ian Clark is, but you as a coach/player better realize what spots he likes or he will hurt you more than you realize.
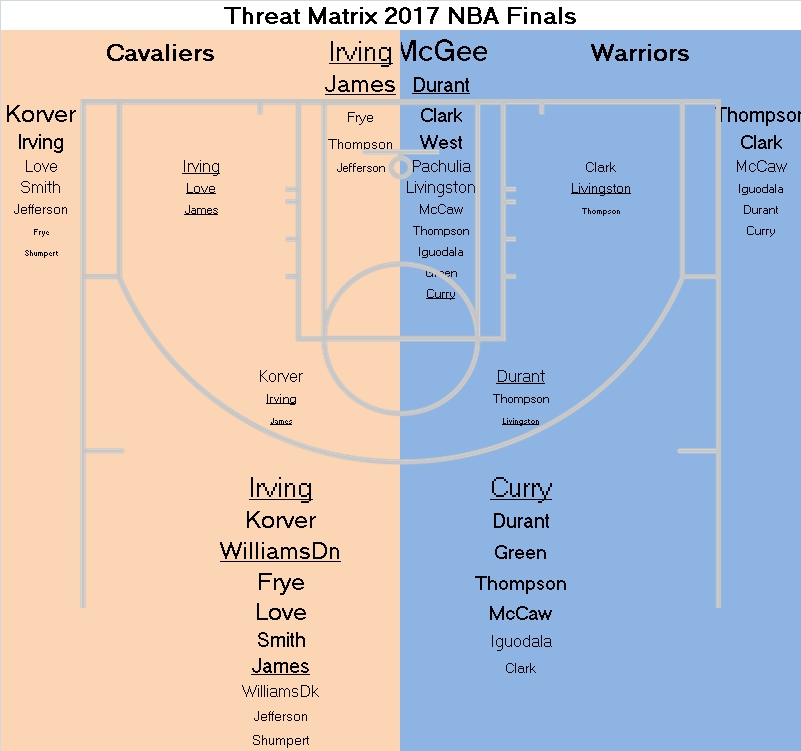
The number of threats run deep on these teams, but it's also where the shots actually come from that creates some challenging help schemes or a lot of running by defenders. This figure shows the Cavs on the left and the Warriors on the right for the shots you really need to deal with (assuming symmetry from side-to-side, for simplicity). These are shots that, if you just give them, you're giving away points. The size of the players reflects how important those shots are. Players with underlines represent shots often taken off the dribble.
There is a lot to digest from the image. The size of the names, the locations of the names, the underlines - there is a lot of information here. Just a sampling of what those things mean in words:
The big picture story here is that there are guys all over the place that you have to stop. Try to focus less on the smaller names, but how you rotate your players to do this is tricky. Lebron James at the rim is essentially the same importance as Kyle Korver on the wing or in the corner - and Korver gets most of his 3s as assists from Lebron. So don't leave Korver to help with Lebron. Leave someone else - like Shumpert or Tristan Thompson. You'd prefer to leave Love in the corner (which sounds like the title to a pop song) than Lebron at the rim, but it's painful either way. Kyrie's name is pretty big everywhere, so you really just shouldn't help off him. Thompson looks like the half court weakness here, even though his offensive rebounding is important.
For the Warriors, who got pressured by the Cavs all over the floor late in last year's Finals because they couldn't dribble by them, they now have a couple guys who can get to the rim off the dribble. Kevin Durant is the big addition here, but Curry is also a bigger threat with his legs feeling better. Everyone's ability to go to the rim is strengthened because of the threat beyond the arc, which is why the Warriors have so many guys listed as rim threats. (By the way, Curry and Thompson make up 40% of the top shooting games in the last 30 years or so. I am missing some games, so this isn't quite comprehensive.)
Top Shooting Games Last ~30 Years (Marginal Points Above Average), ignoring Free Throws
| Player | Date | Tm | Opp | eFG% | MargPts | FGM | FGA | FG3M | FG3A | PTS |
| Stephen Curry | 2/25/16 | GSW | ORL | 93% | 23.08 | 20 | 27 | 10 | 15 | 51 |
| Dana Barros | 3/14/95 | PHI | HOU | 92% | 22.08 | 21 | 26 | 6 | 8 | 50 |
| Stephen Curry | 2/3/16 | GSW | WAS | 88% | 21.08 | 19 | 28 | 11 | 16 | 51 |
| Glen Rice | 4/15/95 | MIA | ORL | 87% | 20.08 | 20 | 27 | 7 | 8 | 56 |
| Lebron James | 3/3/14 | MIA | CHA | 79% | 19.10 | 22 | 33 | 8 | 10 | 61 |
| Michael Jordan | 11/16/88 | CHI | PHI | 83% | 19.09 | 24 | 29 | 0 | 1 | 52 |
| Stephen Curry | 2/27/13 | GSW | NYK | 84% | 19.08 | 18 | 28 | 11 | 13 | 54 |
| Stephen Curry | 11/7/16 | GSW | NOR | 87% | 19.08 | 16 | 26 | 13 | 17 | 46 |
| Stephen Curry | 4/9/15 | GSW | POR | 91% | 19.07 | 17 | 23 | 8 | 13 | 45 |
| Stephen Curry | 2/1/17 | GSW | CHA | 98% | 19.06 | 14 | 20 | 11 | 15 | 39 |
| Dale Ellis | 4/20/90 | SEA | LAC | 109% | 19.05 | 13 | 16 | 9 | 11 | 36 |
| Allen Iverson | 5/16/01 | PHI | TOR | 78% | 18.10 | 21 | 32 | 8 | 14 | 52 |
| Jamal Crawford | 1/26/07 | NYK | MIA | 80% | 18.09 | 20 | 30 | 8 | 10 | 52 |
| Tracy Mcgrady | 11/14/03 | ORL | DEN | 80% | 18.09 | 20 | 30 | 8 | 11 | 51 |
| Vince Carter | 5/11/01 | TOR | PHI | 81% | 18.09 | 19 | 29 | 9 | 13 | 50 |
| Wally Szczerbiak | 4/13/03 | MIN | CHI | 85% | 18.08 | 19 | 26 | 6 | 7 | 44 |
| Klay Thompson | 1/23/15 | GSW | SAC | 86% | 18.08 | 16 | 25 | 11 | 15 | 52 |
| Dirk Nowitzki | 1/27/04 | DAL | SEA | 91% | 18.07 | 16 | 22 | 8 | 11 | 43 |
| Manu Ginobili | 2/13/08 | SAN | CLE | 95% | 18.06 | 15 | 20 | 8 | 11 | 46 |
| Klay Thompson | 4/13/15 | GSW | MEM | 95% | 18.06 | 15 | 20 | 8 | 10 | 42 |
Both teams in these 2017 Finals present the kind of threat matrix that is brutal to prepare for. Switching and then manning-up against a potential mismatch is critical in handling this. The Warriors know how to do this but the Cavs did it in last year's Finals. There are definitely ways that switches can hurt even if you are defending your mismatch well. James is a mismatch anywhere on the floor; Durant can be, too. If this series ends up with more isolation for James/Durant, then the defenses have figured out all the off-ball screening that is such a great part of modern basketball. I'm hoping and predicting that we won't get there.