Is Tanking a
Viable Team Building Strategy?
Introducing the Sauriol Success Matrix
By David Sauriol
Email the author
1 January, 2018
(Editor's Note: David Sauriol is a student that I had in a class that I teach at
SMWW.
During that class, I generally advise not to create a player-valuation system because
several exist and because improving upon them is very hard. What David is introducing here
is actually a simplified system that separates from an analysis of how players add to winning,
but creates a more analytics-independent classification system. This is useful
because it is easy and because a lot of people think this way. It can be used in concert
with more analytically-based metrics to look for where analytics and public perception are different.
It can be used in a lot of other ways, but I'll let David take it from here.)
Success
not just in basketball, but also in life is a highly subjective thing. What you personally see as success in a NBA player
might be a lot different than what I personally see. Is a player successful if
he can score 12 points a game or have 8 rebounds per game? Analysts and talent
evaluators could debate forever what the thresholds statistically would be, and
even still it would be very contextual. The Sauriol Success matrix (or SSM) was
created to provide a uniform framework for classifying the levels of success of
NBA player careers based on unambiguous but simple statistics.
The SSM uses the most direct sources to
determine what constitutes NBA career success: the views of NBA coaches, media and
executives. These are the people that will decide which players get into games,
start games, are selected to All-Star and All-NBA
Teams, and even how long their careers last. By analyzing the number of All NBA team appearances, All-Star
Game appearances, seasons played, games played, games started, and minutes
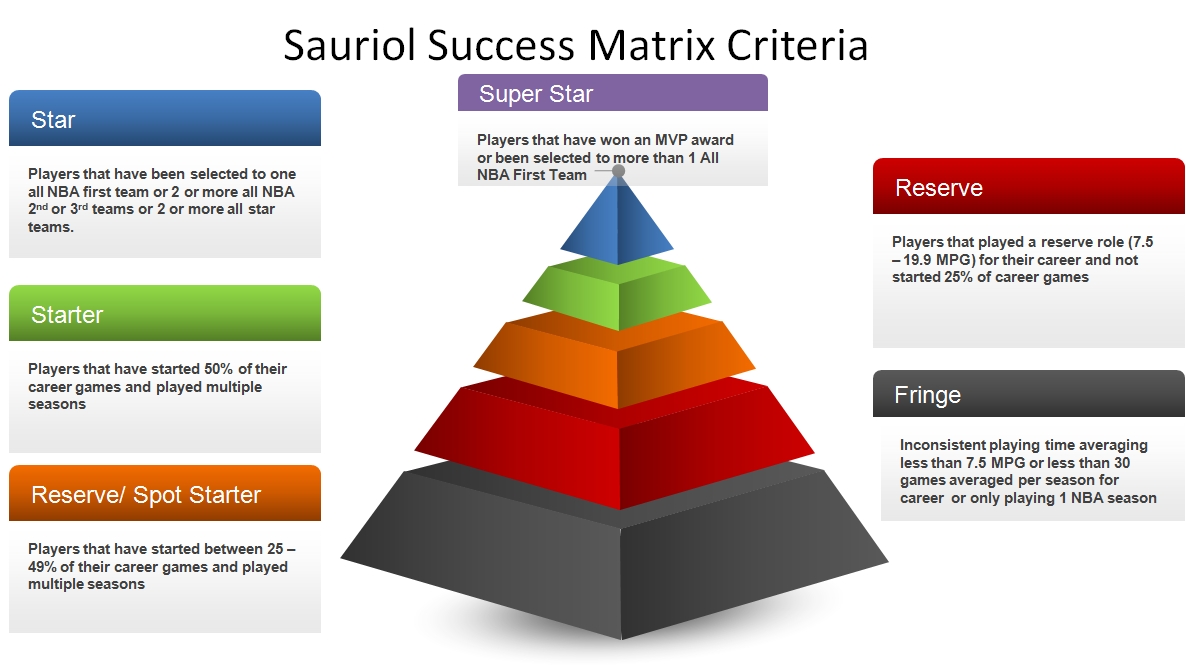
played, the players are grouped into six categories:
- Superstars,
- Starters,
- Reserve/Spot Starters,
- Reserves, and
- Fringe Players
The
first four tiers – Superstar, Star, Starter and Reserve/ Spot Starters –
cumulatively make up another grouping, “Core Rotation” which essentially indicates
players that play regularly. All relevant statistics required for the SSM have been available since 1981.
Tiers
of the SSM
The following graphics show the SSM tiers
and a simplified version of their basic rules. Though the rules have some
nuances to handle edge cases, these simplified rules capture a lot. The
detailed elements of the SSM and how to calculate it are found
here.
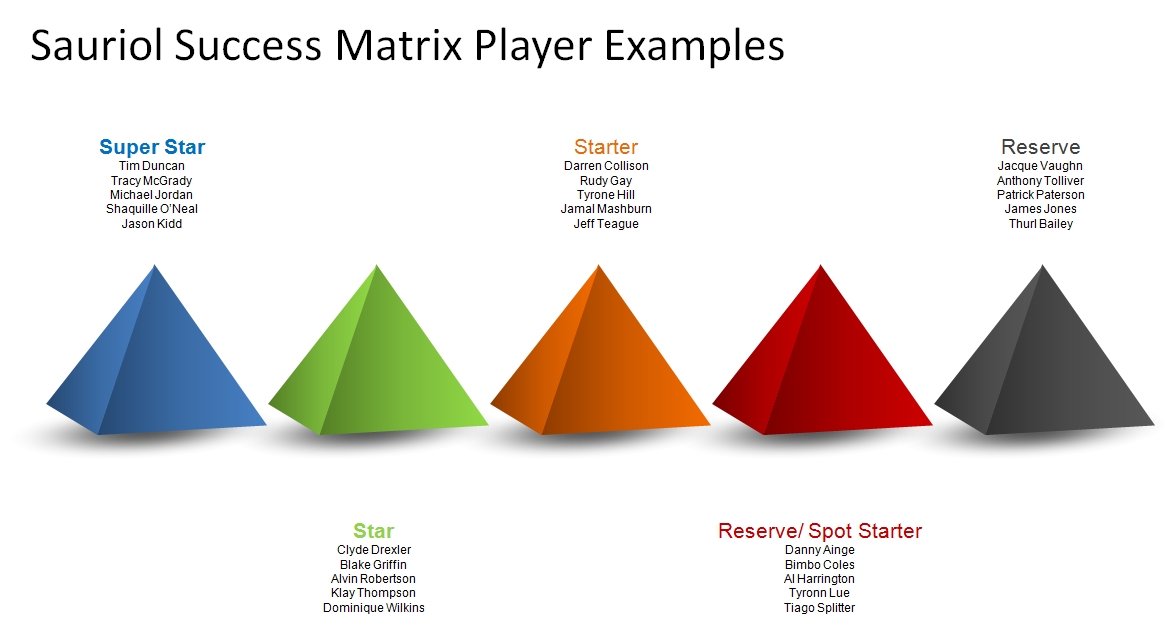
Look at the following graphic to see examples
of players since 1981 that fall into each tier of success.
Why
develop the SSM when a lot of player rating methods exist?
Whereas other rating systems rank players
numerically, the SSM is a categorical system that takes some basic statistics
and general consensus to classify players broadly into categories. This
distinction means that rather than viewing players individually they can be
studied as a group within their SSM classification. For instance, the 399
players classified as “Starters” can be examined with high quality analytics to
help understand who is “underrated” and “overrated” in a systematic way. The
SSM also simply provides a summary of a lot of the basic stats people start
with when discussing players – which is commonly used in making draft
decisions, trade decisions, or starting contract negotiations.
What
can the SSM Do?
By being a good historical reference
on players, the SSM can also play an important predictive
role in uncovering the next successful NBA players. Historical documentation of
the factors that have led to Superstar, Star, and Starter level players previously
can be combined with existing analytics (like for the Draft) and scouting methods to uncover players
with similar indicators of success. This means that by sorting through both
statistical (ex: a player’s career rebounding percentage) and non-statistical
(ex: where a players is from) factors, the SSM can help basketball talent
evaluators predict future successful players.
Of course this is not all it can do. The
following case study will show one of the SSM’s potential uses.
Is
Tanking Worth it?
Trust the Process… that’s what they have said around
Philadelphia, beginning with the period with Sam Hinkie as general manager.
The Stanford MBA grad cum NBA general manager felt that he was using the only
device at his disposal to acquire a Superstar - tanking three straight seasons!
In his view, a team needs a Superstar to have any chance of winning an NBA
title. Time is going to show whether Ben Simmons or Joel Embiid
becomes that Superstar he coveted. In the meantime, however, the SSM can be
used to look at the question historically to see if tanking gives a good chance
for a team to land a Superstar in a single season or, like the
Sixers, over multiple seasons. The Sam Hinkie
teams are a useful example, as from 2013 team to the 2016 team (not in
sequential order), these teams had the worst, second worst, and third worst
records in the NBA.
First, see the table below for some example #1 picks
that qualify as Superstars and Stars under the SSM method. Obviously, getting access to a pool of players that has
included Lebron James, Hakeem Olajuwon and Shaq “might”
be worth enduring some losing. I say “might” as it is hard to say culturally
what extended losing potentially does to a team.
On the other hand, Derrick Coleman and Ralph Sampson may have qualified as Stars due to
their All-Star selections and their teams may have been happy to have had them, but whether
they really added as many wins as true stars is up to analytics.
|
SSM Tier
|
Players
|
|
Superstars
|
Anthony Davis, Tim Duncan, Dwight
Howard, Allen Iverson, Lebron James, Hakeem
Olajuwon, Shaquille O’Neal, David Robinson, Derrick Rose
|
|
Stars
|
Mark Aguirre, Elton Brand, Derrick Coleman, Brad
Daugherty, Patrick Ewing, Blake Griffin, Kyrie Irving, Danny Manning, Yao
Ming, Glenn Robinson, Ralph Sampson, John Wall, Chris Webber, James Worthy
|
The History
of the Draft Lottery
Prior to 1985, the teams drafted in reverse
order of their record, with no random chance involved. This meant that teams truly could tank to get the first
pick. It took a while, but the NBA eventually realized that teams would go through the pain of
intentionally losing games to try to get players like Ralph Sampson and Hakeem
Olajuwon. So in 1985, they created the first draft lottery which gave all
non-playoff teams an equal chance of getting the 1st through 14th picks. Only 2
years later in 1987, this was changed to allow reverse order by record for all
but 3 teams. Originally, the odds were fairly low for the team with the worst
record getting the first pick sitting at 16.67%. These odds were altered in
1994 to 25% and again in 2005, with the latter changing the odds for picks
below first. The odds were changed again at the 2017 NBA board of governors
meeting. Coming into effect at the 2019 Draft lottery, the first 3 teams will
all have a 14% chance of receiving the first pick.
Lessons
from the 76ers
So what does this mean for the formerly Sam Hinkie
led 76ers? Let us consider the single season
finishes (worst record, second worst record, etc.) for those teams and look at
the odds historically that they, or any team that finished at the same
position, would have landed a Superstar or a Star to make their tanking worth
it. Shown below are the applicable draft lottery
odds (during the Hinkie years) that are then multiplied by the odds of landing a specific SSM tier player,
resulting in an overall probability of getting a Superstar, etc., based on record.
As you can see the odds of getting a Star level player are fairly flat from the
worst record to the sixth worst record, declining by about half from first worst to sixth worst.
The Superstar chances decline by more than that and drop under 1% at around the tenth pick.
|
SSM Category
|
Worst Record
|
2nd Worst Record
|
3rd Worst Record
|
4th Worst Record
|
5th Worst Record
|
6th Worst Record
|
NBA Player Overall
|
|
Superstar
|
12.35%
|
11.84%
|
11.31%
|
10.09%
|
7.40%
|
3.96%
|
1.21%
|
|
Star
|
22.36%
|
21.01%
|
19.52%
|
17.64%
|
15.43%
|
13.82%
|
4.02%
|
|
Star or Superstar
|
34.71%
|
32.85%
|
30.83%
|
27.73%
|
22.83%
|
17.78%
|
5.23%
|
Figure 1: The odds of the
Philadelphia 76ers landing top picks and their corresponding chance of A)
getting a Superstar and B) Either a Superstar or a Star level player based upon
that chance.
2013-14 The Sixers were 19 – 63
and finished 29th out of 30 teams in the league. In a normal year, as
you can see in Figure
1,
even with the second worst record it is no easy feat to land a Superstar level Player.
The odds of landing a Superstar player historically, not accounting for the
specifics of the 2014 draft class, are 12%. They improve to 21% for landing a star, or 32.85%
of landing one or the other.
In that year, the Sixers fell to the third pick (with the second worst record) but were
able to land the consensus top player in Joel Embiid
because of medical concerns. Time will tell if Embiid
will be able to hold up physically. He has already missed his entire first two
years in the NBA due to injury, but he has shown in very limited time in his third
and fourth years the talent that earned him the label “Olajuwon with a
jump shot”.
2014-15: The
Sixers were 18 – 64 and finished 28th out of 30 teams in the league (or third worst).
With this record, a team would have a 11% chance of
drafting a Superstar and a 20% of a Star for a combined 31% probability
of getting one or the other. In this draft, the Sixers got the third pick and
selected Jahlil Okafor. At this point in time, Okafor is a player who would have been better playing
10 years ago as he is struggling to find a place in the modern NBA. He did put
up solid numbers his first seasons but advanced analytics have consistently
shown that his team is better when he is not playing. In fact, in 2017, the Sixers did not pick
up his fourth year rookie option.
2015-16:
The Sixers were 10 – 72 and finished 30th out of 30 teams in the
league, the first year that the Sixers “succeeded” in tanking with the worst
record. Even with the worst record in the NBA, the Sixers only had a 12%
chance of getting a Superstar and 35% of getting either a Star or Superstar.
The Sixers did get the first pick in this draft and selected Ben Simmons. Like
Joel Embiid before him, he ended up missing his entire
rookie year due to injury. In his second year, there are some very encouraging
signs that he may develop into a Superstar or at least a Star level player. With
both these players, they are clearly Starters by the SSM method, but it will
take time to determine if they are Stars or better.
Overall, the 76ers were a bit lucky to have not fallen
further in the Lottery than they did. They were also lucky - in a sense - to have had Embiid's
injury issues show up pre-Draft and deter teams ahead of them from drafting him. (How different
would the league look had the Cavs taken Embiid over Andrew Wiggins, who they traded to get
Kevin Love?)
Final Thoughts on Tanking
Beyond the Sixers and looking at the
numbers for a single season, one has to question tanking as a team
building strategy. Trying to get "ahead" by losing even more than some of the other
bad teams doesn't dramatically increase the blind odds of getting a Star. Getting
a Superstar is easier in the worst five records, but those blind odds are still
roughly 1 in 10, not a guarantee. Not shown above are the pick-by-pick odds from #7 out to #14,
but the Star blind odds tend to be in the 10-15% range and the Superstar
values are in the 0.5% to 5% range. Whether teams find it valuable to
tank for those additional few percentage points is, in some ways, up to them, but
we put the probabilities out there for them to make calculations as they wish.
We call these odds "blind" because
they don't account for the quality of the talent in the Draft nor of the
quality of the scouts helping to select the player in the Draft. Any individual
team can improve the quality of their staff to make better picks probably as much as
through tanking, if not more. This then avoids the negative consequences of intentionally
losing, such as
·
Financial: The majority of owners would
not be willing to see the brand of their team take such a hit. Multiple years
losing with a clear pathway towards success will definitely impact the ability
a team has to sell tickets to games, draw television viewership and sell team
merchandise.
·
Fan Base: Consistent losing will push
away a lot of casual fans and see them move to other sports. Beyond the revenue
loss this entails the more serious issue is that it could take years of success
to attract their interest again.
·
Team Culture: Losing at that level can
become systemic within the team and create a culture whereas losing is accepted
as “normal.” A culture like this might not simply reset with potential star
level players like Embiid and Simmons finally taking
the court together, it could take years to redefine itself into a positive.
(See this
for some previous work on the matter)
In conclusion, although the odds of landing
a Superstar are not amazing at any finish record wise, teams can still land
solid Starters with top draft picks. Within the draft lottery 75% of players
end up in the core rotation, meaning they are players who at least start between
25 – 49% of their career games and play regular NBA minutes. Often they are
better than that. This might not sound like much, compared to our previous
conversation about landing Superstar and Star players, but having these
foundational players are crucial for teams. For some context the rate of core
rotation players falls to 40% from picks 16 to 30 and down to 20% in the second
round. Collecting solid rotational talent has been a strategy that the Boston
Celtics have used to rebuild their roster. Once they had collected enough solid
players they had pieces that could be used to acquire a Star level talent in
Kyrie Irving via trade and attract other Star level free agents like Gordon
Hayward.
The
Future of the SSM
Evaluating whether tanking is a good NBA
strategy is just the tip of the iceberg. Here are a couple topics to look for
in the coming weeks.
·
What regions of the world
produce the most successful NBA Players?
·
Grading NBA trades using the
SSM
·
What is the architecture of NBA
championship teams? What is the SSM composition of some of those teams? Is
there a pattern?
Larger topics will be assessed using the
SSM also. Two major projects I will be looking into are first evaluating
college or international performance to look for indicators in young players
that can be used as predictors for future NBA success. Secondly, I am looking
at NBA players first three seasons to identify traditional and advanced
statistical indicators that can also be later used as predictors of success for
the remainder of that player’s career.