Misconceptions and Truths of Women's Basketball, Part II
Dateline: 09/10/98
THE WOMEN'S NBA ENDED THEIR CHAMPIONSHIP
series on September 1 with, for those who don't pay attention to such things,
the Houston Comets taking care of the Phoenix Mercury. The Comets
came in as heavy favorites, having won 27 of their 30 regular season games,
sweeping their first round playoff series, having the best player in the league in
Cynthia Cooper, and generally dominating the competition like no
team has ever done in pro basketball...
...That includes the Chicago Bulls. The Bulls' success of the past several
seasons has been downplayed by those making comparisons of the greatest teams
because the Bulls have supposedly done it against a "watered-down NBA".
For years,
I'd wondered what "watered-down" meant and specifically doubted the theory.
With the utter domination of the WNBA Comets and the ABL Quest
-- both teams having won two titles convincingly --
it further convinces me that it is actually
easier to dominate a small league than a large one like the NBA.
|
It is actually
easier to dominate a small league than a large one like the NBA.
|
I haven't found a way to absolutely prove this suspicion, but I will explain
some of my other reasons.
... Reason Number 1 ...
First of all, I had a younger brother, which serves as a tremendous learning
experience, for those who don't know. Growing up, he and I played sports and
games all the time and I always beat him. I could dominate
in such things as underwater distance swimming and rubber band fights, but
if we got other neighborhood kids involved, it was much more challenging
to win. Hence, at the wise old age of 12 -- before I even knew what
a credit card was -- the following general rule formed
in my mind: The more competitors there are, the more difficult it is to win.
... Reason Number 2 ...
Second, the distribution of talent in the pro leagues
is such that it is more conducive to domination (great
teams) in smaller leagues. I can give a somewhat
numerical demonstration, though it is not as convincing
as I'd like it to be:
Borrowing a discussion from Bill James' Baseball Abstract,
top pro talent (whether its
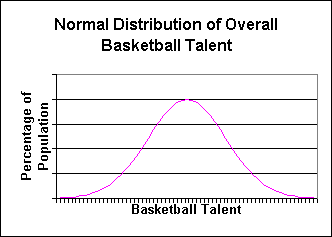
baseball or basketball) is not Normally distributed.
A Normal distribution
of talent in basketball would look like this:

There is a large number of people who are average (in
the middle of the chart) and a smaller
number of people who are either completely inept or very good (on
the edges of the chart).
This distribution describes the general population, not the
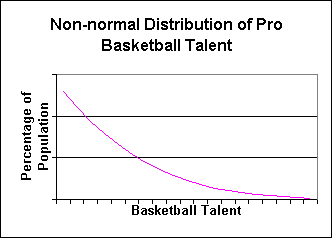
pro leagues. The pro leagues draw from the right side of this distribution,
giving a distribution of talent in the pro leagues that looks more
like this:

There are very few great players in the pros, a lot more mediocre players,
and even more bad players. That is what this chart says.
Essentially, the pro leagues draw the top 0.001% of the population for
the basketball occupation. (In other words kids, you have only a slightly smaller chance of
getting killed by a bee sting than making it to the pros.) If they do
it right and truly get every one of that 0.001%, we can do a simplified
experiment to show how much better the best team in the league
can be relative to the second best team for different sized leagues.
For that experiment, I will assume for simplicity that teams collect
talent in a draft-like manner -- one team grabs the best player,
a second grabs the next best, until the end of the teams, then the first team
gets to start again. (I haven't thoroughly tested, but I believe that
most ways of distributing talent cause the same effect I will show.)
Given this way of allocating talent and the above pro talent distribution,
I looked at a two-team league and a ten-team league where talent was
distributed like it is in the pros.
The absolute numbers (whose development I'll describe at
the end) don't mean very much,
but the relative strength of
the best team to the second best team does demonstrate the point.
For the two-team league, I found that the best team was about
1.5% better than the second best team. For the ten-team league,
the best team was about 1.0% better than the second best team.
As I mentioned, these numbers aren't as convincing as I'd like.
The principal reason is that it is not looking at the precisely
right question. This simple experiment compares idealized scenarios
where draft order is precise, talent is precisely known, and that
talent leads to precisely predictable results. A better study would be
this: do a statistical evaluation of the chances for a team to be
X% above 50% in different sized leagues where talent is coming from the
top 0.001% of a Normal distribution. For example, this is
the basic study question: What is the random
chance of building a team that wins 80% or 90% of their
games in a 10 team league vs the same team in a 30 team league?
This is a graduate-school level statistical study requiring
really good math skills and/or some computer programming, but definitely
requiring some time. I'm hoping that someone can carry out
such a study and pass on the results to me.
... Reason Number 3 ...
A third reason to believe that the small women's leagues are
easier to dominate is that there are two women's leagues
competing for the best talent.
This creates talent gaps in the distribution that each of the leagues
is drawing from, effectively adding to variability. This variability,
using the terminology of Reason 2, makes it more likely that
a team will win 90% of their games.
Cynthia Cooper provides good evidence for
this. The ABL, which has had the best talent overall
by paying higher salaries, somehow missed Cynthia Cooper, who may
be the best pro women's basketball player in the U.S. Having her
in the ABL would likely have made it harder for Columbus to win
back-to-back titles.
... Reason Number 4 ...
Finally, the evaluation of women's talent is imperfect
and currently not as good as the evaluation of men's talent. Imperfect
information adds noise or variability (as described in
Basketball's Bell Curve and The Effect of
Bad Referees). As mentioned in Reason 3, variability
makes it more likely that
a team will win 90% of their games.
Once again, I'll use Cooper and the Comets as an example.
The WNBA, which apportioned
talent roughly evenly when it started, accidentally stuck Cooper
on a team with Sheryl Swoopes
because people didn't realize how good Cooper was. Somehow (and
I haven't been able to track down how), the Comets also
had the number 1 draft pick in the inaugural season, which
landed them Tina Thompson, another key part to their
back-to-back titles.
... So What Is More Impressive? ...
Ultimately, the argument over what is more impressive domination --
the Comets, the Quest, or the Bulls -- is not one with an
answer. I am quite sure that it is probabilistically more likely
to get a dominant team in small leagues like the women's leagues.
That may not be the right standard, however. People like to compare the
Bulls players at every position to historically great teams like
the Lakers and Celtics, and, frankly,
the Bulls cannot stand up to that comparison. That may be a decent
standard, but, like comparisons of great players now to great players
30 years ago, there is a mismatch in conditions -- like the number of
teams in the league -- that blur comparisons to the point that opinion
is all that is left.
The aim to simulate teams is the most fundamental of my work. In this case,
I do it in a very simplified manner, using numbers that don't mean anything
real, but provide a way to compare teams within the same league.
In particular, the fundamental assumption going into this study was that
talent was distributed in the pros from the far right side of a Normal distribution.
For a two-team league, then, I generated the upper 0.2% of values from a
Normal distribution (that distribution having an average of 0, standard
deviation of 0.1), taking those 0.2% to be the top 20 players to
be distributed among two teams. That distribution is shown below:
| Distributing Talent in Two-Team League |
Percentile
of Talent |
Quality |
Team 1
Players |
Team 2
Players |
| 99.80% |
0.2878 |
|
0.2878 |
| 99.81% |
0.2894 |
0.2894 |
|
| 99.82% |
0.2911 |
|
0.2911 |
| 99.83% |
0.2929 |
0.2929 |
|
| 99.84% |
0.2948 |
|
0.2948 |
| 99.85% |
0.2968 |
0.2968 |
|
| 99.86% |
0.2989 |
|
0.2989 |
| 99.87% |
0.3012 |
0.3012 |
|
| 99.88% |
0.3036 |
|
0.3036 |
| 99.89% |
0.3062 |
0.3062 |
|
| 99.90% |
0.3090 |
|
0.3090 |
| 99.91% |
0.3121 |
0.3121 |
|
| 99.92% |
0.3156 |
|
0.3156 |
| 99.93% |
0.3195 |
0.3195 |
|
| 99.94% |
0.3239 |
|
0.3239 |
| 99.95% |
0.3290 |
0.3290 |
|
| 99.96% |
0.3353 |
|
0.3353 |
| 99.97% |
0.3432 |
0.3432 |
|
| 99.98% |
0.3540 |
|
0.3540 |
| 99.99% |
0.3719 |
0.3719 |
|
The second column was generated in MS Excel using the formula
=NORMINV(Percentile,0,0.1). For example, 0.372=NORMINV(0.9999,0,0.1)
forms the last line of the table. The third and fourth columns
show how the talent was distributed to the two teams, the two
teams alternating.
With this distribution of talent, the average of the "quality"
was calculated for the two teams. Team 1 has an average "quality"
of 0.3162; team 2 has an average quality of 0.3114. The ratio is
1.015, or 1.5% better, as quoted above.
The same procedure was carried out for the ten-team league.

