The Decision Maker: Charlotte Hornet owner, George Shinn.
Advisor: Dean Oliver.
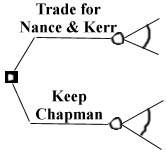
The Decision: Whether or not to accept an offer from the Cleveland Cavaliers of power forward/center Larry Nance and guard Steve Kerr for our starting shooting guard Rex Chapman.
The Answer: Accept the trade offer from Cleveland.
The Decision Tree
What makes this decision difficult is the infinite number of possible outcomes. A player can improve or hurt a team in many different ways, such as rebounding, points scored, defense, leadership, etc. He can do all this over different time periods - from one game to one season to more than ten seasons. Combining all these factors into a set of coherent data is next to impossible. Here, we will look at a couple attempts to do this and the uncertainties that make such work difficult.
The trade offered by Cleveland is based on their need for a shooting guard and the Charlotte Hornets' need for a solid big man and reserve point guard. Cleveland sees Rex Chapman (age 23) as the shooting guard of their future, whereas the Hornets can use Larry Nance's (age 31) size and rebounding ability right now while he's not too old. Steve Kerr (age 25) is offered as a possible reserve point guard who has shown some signs of being a good player, but a player that Cleveland doesn't envision as the answer to their problems at shooting guard.
Rex Chapman was seen in college as a player with enormous potential. He turned professional after his sophomore year at Kentucky and was made the very first draft pick of the Charlotte Hornets. As a 21-year-old rookie, he moved immediately into the starting lineup, a rare feat in the NBA, but not especially surprising for the expansion Hornets. Chapman's performance his rookie year was less than impressive as he shot only 41.4% from the field and scored on only 46.1% of his possessions, as compared to the league averages of 47.7% and 52.8%. Chapman's showing in his second year was no better with a field goal percentage of 40.8% and a floor percentage of 45.0%, compared to similar league averages. Still, some NBA personnel is high on Chapman, pointing out that '90-91 would be his rookie year if he had stayed in college and that he began to play better before getting injured last season. The Hornets have two other shooting guards on their roster - rookie Kendall Gill, seen as a tremendous athlete not very different from Chapman himself, and Dell Curry, a streaky shooter who could still improve but will probably remain only a reserve.
Larry Nance has been one of the top five power forwards in the NBA for most of the past ten years. His rebounding, scoring, and defense are widely known to be consistently good from game to game and season to season. His value in Cleveland has gone down due to recent signings of younger players with great talent. Also, he missed 20 games last season due to lingering injuries.
Steve Kerr was one of the last cuts from the 1988 Olympic Basketball team, but failed to impress many NBA experts with his skills. He arrived in the league with questions about his quickness, his shooting, and his ball-handling. He has not really answered these questions, occasionally showing flashes of development into a solid player, then going into a bad streak. His long range shooting touch is good, but the other parts of his game have not been very special. In Cleveland, he didn't get very much playing time behind superstar Mark Price, while their current starting shooting guard Craig Ehlo is seen to be best suited for the reserve guard spot.
There are several different ways to determine the outcomes of a trade. The first is a fairly simple screening method known as Trade Value. This method involves estimating how much each player is worth in terms of units of Approximate Value (AV). Each player has an established AV, which is determined from the following formulae:
Credits = PTS + REB + AST + STL + BLK - TO - Missed FG - Missed FT

AV = Credits3/4/21
where PTS represents the number of points scored by the player in a season, REB represents his rebounds, AST represents his assists, STL represents his steals, BLK represents his blocked shots, TO represents his turnovers, Missed FG represents field goals missed, and Missed FT represents free throws missed.
Credits and AV's are calculated for each of the past three seasons, then an established AV level is calculated using a weighted average:
Established AV= EAV = [3*(AV'90)+2*(AV'89)+(AV'88)]/6,
where AV'90 is the players AV in the 1990 season, etc. For players who have played fewer than three years, the above equation for EAV is modified. For this trade decision, both Kerr and Chapman have played only two years and their EAV's would come from
EAV = [2(AV'90) + (AV'89)]/3.
In order to determine a player's Trade Value, it is important to know not only his established playing ability, but how much longer he is going to be able to perform at that level. This obviously requires a bit of predictive talent (i.e. a crystal ball), but a simple formula serves adequately here. Trade value then combines EAV and a factor Y to reach an estimate of a player's remaining worth:
Trade Value = (EAV - Y)2*(Y + 1)EAV/190 + Y2*(EAV/13)
where
Y = 27 - 0.75*Age.
Trade values have been determined for the three players involved in the trade and are shown in detail in attached Table 1 and shown below in summary.
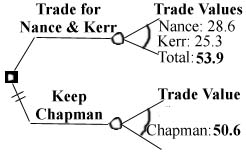
Notice that the total of the trade values for the players offered is slightly higher than Chapman's trade value. This tends to indicate that Cleveland is offering us a good trade, but the uncertainties involved in this methodology are large. Trade values really give just a first indication that the trade is even.
Actually, calculated trade values are often equal for players that are traded for each other, indicating that general managers and personnel that control player transactions see trade value the same way the above formulae do.
The above numbers are all approximate values, emphasis on the 'approximate'. A trade value of 50 does not mean 50 additional wins, 50 additional points, or 50 of anything that can be physically measured or counted. Trade values, AV's, and EAV's are all relative estimates of a player's worth.
The credits formula from which these values are derived, however, was originally intended to do something meaningful. Credits were initially meant to approximate the number of points a player contributed through all measurable aspects of the game; in fact, some analysts still claim that they do this. The above formula, from Manley (1987), is the simplest version available, which does not mean that it is the least accurate. This formula approximates 1 REB, 1 AST, 1 STL, etc. as equivalent to a 1 point benefit; it approximates 1 TO, 1 missed FG, etc. as costing 1 point. This approximation has been contested, leading to other credits formulae from Heeren (1988), Trupin & Couzens (1989), and Barry (from Manley, 1987). As a form of sensitivity analysis, these formulae were all tested to see if the made significant changes in resultant trade values, as shown in the box below the figures that follow (referred to as Table 2). (See Appendix for the different versions of credit formulae.)
The other part of trade value, the Y factor, is also important and more uncertain than the EAV. The Y factor is approximately the number of years a player has left in his career, though theoretically it means a bit more which need not be discussed here. The formula used above is poorly tested and has been replaced in other studies by one of two other formulae:
Quickly Aging Form:
Y = 29 - 0.85*Age
or
Slowly Aging Form:
Y = 24 - 0.65*Age
As another form of sensitivity analysis, results using different versions of the Credits formula and different versions of Y are summarized in Table 2 above and in the following figures.
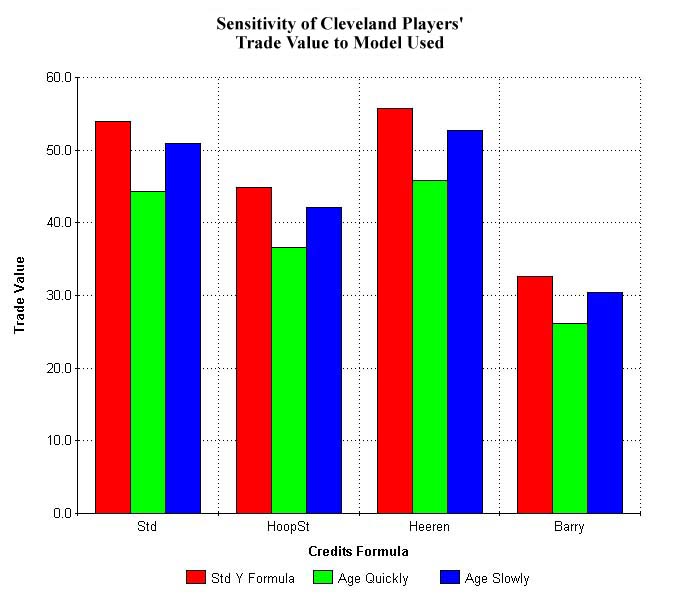
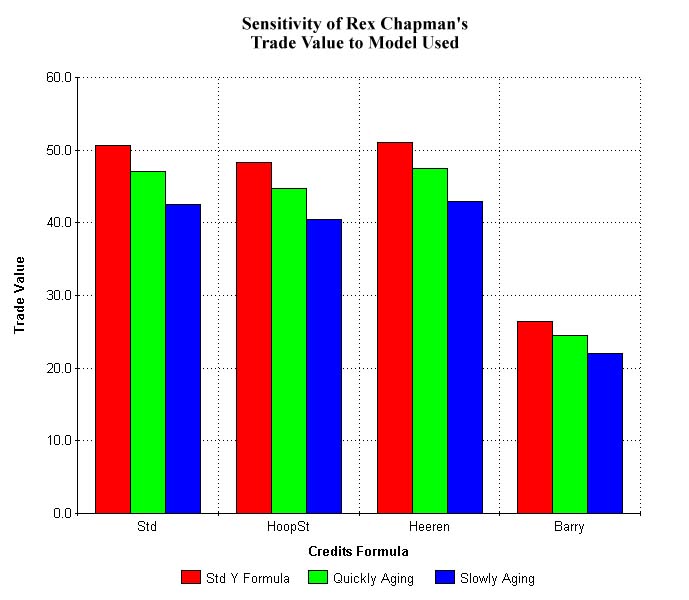
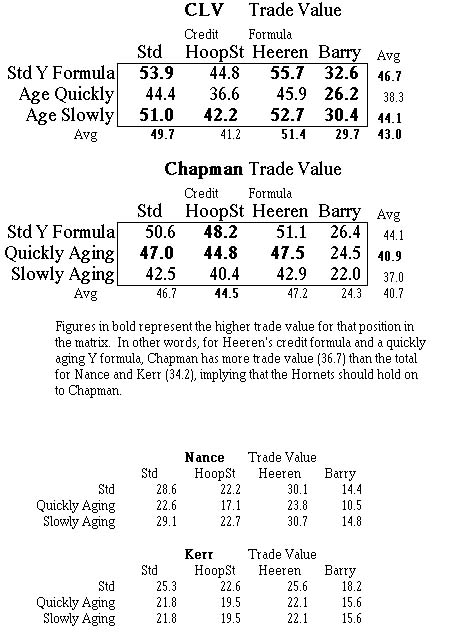 The table shows a couple things. First of all, the fact that
8 out of 12 entries in the Cleveland matrix are bold indicates
that the players they are offering are probably more valuable
than Chapman. Second, the fact that three of the entries where
Chapman looks better are in the 'Quickly Aging' row indicates
that better knowledge of the futures of the ballplayers (his Y
factor) is probably more important than better knowledge of his
established level of play.
The table shows a couple things. First of all, the fact that
8 out of 12 entries in the Cleveland matrix are bold indicates
that the players they are offering are probably more valuable
than Chapman. Second, the fact that three of the entries where
Chapman looks better are in the 'Quickly Aging' row indicates
that better knowledge of the futures of the ballplayers (his Y
factor) is probably more important than better knowledge of his
established level of play.
This is a very unfortunate result because predicting the length of a player's career is extremely difficult. A player can retire on a whim in the middle of his career. He can suffer a freak accident either on or off the court. His coaches may sour on him and refuse to play him. He may quit basketball to protest the declining state of the environment. Players can do odd things. [Note: The trade value formula attempts to take into account typical aging effects on quality of play, including injuries that might lead to one missed season or chronic pains that might lead to several missed games per year.]
[Technical Note: Notice that Chapman has less trade value using the slowly aging Y formula than using the quickly aging formula. This indicates that the slowly aging formula 'thinks' that Chapman's level of play is so low that he will be out of the league before natural aging decreases his play. The quickly aging formula starts his aging before his poor ability gets him dropped from the league. Which of the two versions is correct is impossible to know. The standard version of Y doesn't show this bias as much. Also notice that there is more variation in the trade value for the Cleveland players than for Chapman. This is because there are two players involved on Cleveland's end as compared to one on Charlotte's end. This difference in variations would be even larger if Chapman were either a couple years older or a bit better or worse player.]
Based on this screening, using conventional methods of valuing players and several estimates of remaining playing time, there is a good chance that the proposed trade will benefit the Hornets in the long run.
This model is a very new and highly sophisticated (but complicated) method of valuing players. (For complete detail of the method, see The Fundamentals for Analyzing Basketball.) It makes few assumptions about the values of assists, rebounds, etc., and, most importantly, combines these statistics in a logical manner, consistent with the way a basketball game progresses. The ultimate evaluative numbers that result from this method are wins contributed to the team or wins contributed to the team per year, depending on what is deemed more important.
The most important figures, though not the final evaluative numbers, that result from this model are offensive and defensive ratings that indicate how efficient a player is at scoring and defending. These ratings for the players during the '90 basketball season will be used to form a basis of established levels of performance and are given here.
		Off.		Def.
Player 		Rating 		Rating
Nance 		109.0 		103.9
Kerr 		119.3 		105.4
Chapman 	 92.4 		108.3
These ratings represent how many points a player would score given 100 possessions or, for defensive ratings, how many points he would allow if his opponent had 100 possessions. Rex Chapman was not a very efficient scorer, scoring about 92 points per 100 possessions. Couple this with the fact that he allowed roughly 108 points per 100 possessions and it is painfully clear that Chapman hurt the Hornets. (This is not to say, however, that other Hornets were better.)
In Table 3 below is given the best estimate of the progression of the players' careers. These best estimates were taken from an examination of similar players throughout the history of the league. The results are summarized here:
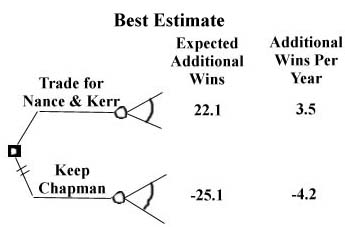
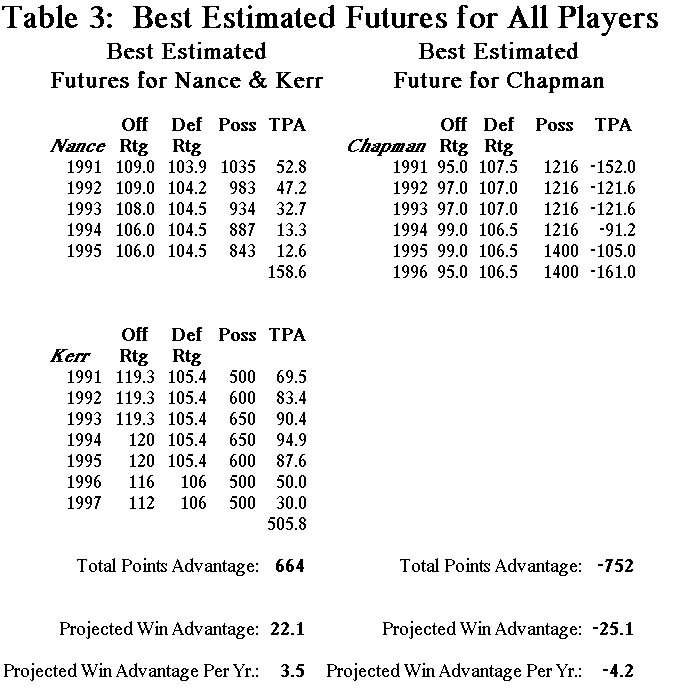
Interpreting the bottom of Table 3 requires some information. First of all, the net number of points contributed by the players over their careers with the team is given by TPA, Total Point Advantage. For the two players from Cleveland, these TPA's can be legitimately added, as opposed to trade values, with which this operation has not been shown to be completely valid. The Total Point Advantages are then given for both alternatives of the trade, showing +664 points over seven years for obtaining Nance and Kerr, -752 points over six years for sticking with Chapman. In some previous work, it has been shown that roughly 30 points is equivalent to one win. This fact has been used to convert the TPA's to wins. Chapman is seen as costing 25.1 wins to Charlotte over six years and Cleveland's pair is seen as contributing 22.1 wins over seven years. [Note: The average wins contributed per year for Cleveland was calculated from (Nance wins)/5yrs + (Kerr wins)/7yrs, not (Total wins = 22.1)/7yrs. Fortunately, it doesn't matter how it is calculated here; the decision is the same.] The best estimate clearly says that Nance and Kerr will benefit the team much more than Chapman will.
The above ratings are fairly certain (roughly ±1.0 for Nance and Chapman and ±2.0 for Kerr) and accurately indicate current levels of quality. The main uncertainty lies again with predicting the future of these players. In the following analysis, we will not look at sensitivities of the formula itself for three reasons, 1. because past statistics that go into the formula are quite accurate and have very little uncertainty associated with them, 2. because the formula is not very sensitive to the few estimates made within it, and 3. because the greatest uncertainty really lies in how long each of the players is expected to remain in the league. We will then take the established offensive and defensive ratings for the players and make the most conservative estimates of the maturing/aging process to show that it is only in this most conservative case when the decision even becomes a close one.
First, let's look at what Cleveland is offering. Larry Nance is an established player, who by most accounts, is very underrated. His career offensive rating is somewhat higher than his offensive rating last year, but he should be on the downslope of his career. His performance in '89 when he was 30 was perhaps his best, with an offensive rating of 115.2, indicating that he doesn't want to grow old fast. An injury at the beginning of last season and the loss of some teammates to injury and trades may be reasons for his decline last year. As a matter of fact, Nance's worst years have been years of great distraction and change - last year, and in '88 when he was traded mid-season. His average offensive rating during those seasons was 110.8 and his average defensive rating was 103.8. As a worst case scenario, we will take Nance's '90 ratings and work with them. Historically, 31-year-old power forwards do not show a drastic reduction in production before they retire. We have taken a worst-case decline in Nance's production and assumed he would retire after three more years of playing; his predicted production is shown in Table 4 below. This is based on a small historical sample of 31-year-old power forwards, who averaged just more than four years of continued play and lesser declines in production.
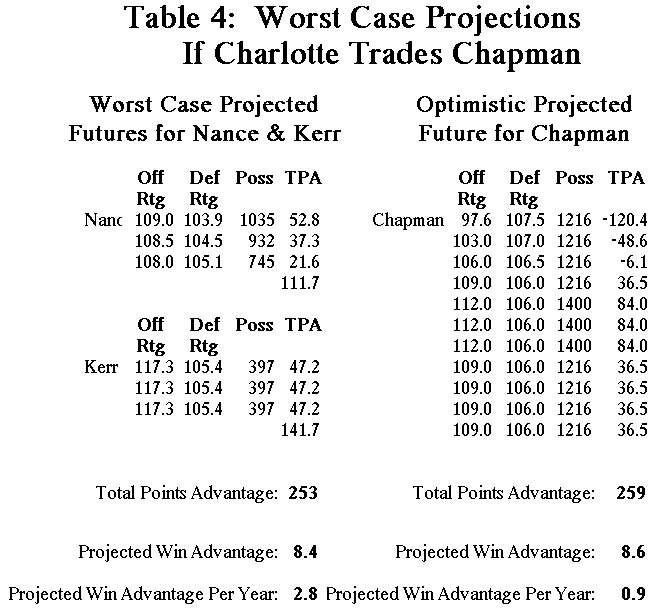
Kerr's future is much more uncertain. Going into his third season, he has proven to be a solid reserve without the spark to make it into a starting lineup. Here, we will make the very conservative assumption that Kerr will remain a reserve player, getting only 1300 minutes per year of playing time behind Charlotte starters Muggsy Bogues and either Kendall Gill or Dell Curry. His efficiency will remain the same until he is released after three years. His offensive rating will be assumed to be 117.3 to take the worst case offensively. Again, this puts the future of Kerr in much dimmer light than most experts would indicate.
For Chapman, it is important to find the most similar players in history to him and try to determine from their development how Chapman will develop. After looking through thousands of players, there is one who appears to be quite similar: 'Sweet' Charlie Williams. A comparison between Williams and Chapman in their first two years is shown in Table 5.
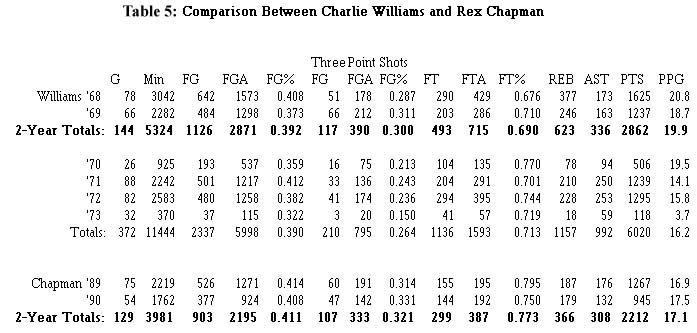
There were a number of other similar players to Chapman throughout history and none were very good. If you go back to the very early '60's, two Hall of Famers - Lenny Wilkens and Elgin Baylor - appear to have very similar stats as Chapman, but the difference in basketball during that time is very significant. While Chapman's 41% shooting from the field is considered poor now, Wilkens and Baylor were both about average for their times, shooting the same 41%. For a sample of 16 players who had stats that closely resemble Chapman's, their average career shooting percentage was 41% and their career spanned an average of 5.2 seasons. In our projections for Chapman's future in Table 3, we have estimated his production as considerably higher than any of these 16 players. We have made very crude estimates of his offensive and defensive ratings, making him out to be an above average player during the prime years between ages 27 and 29. The number of possessions he is estimated to use is based on an average per minute that he used in his first two years, then multiplying by the standard 2300 minutes per year (which is a typical average for a starter over a career, given injuries). It should be emphasized that if Chapman has the sort of career we projected, it would be the biggest career turnaround in the history of professional basketball.
The most conservative case, using the Total Win Model, is summarized below, as compiled from Table 4.
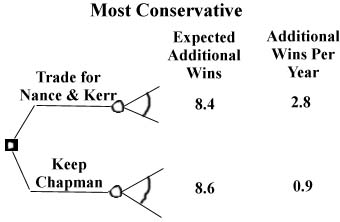
Though trade values provided a shaky yes to the Cleveland offer, the Total Win Model clearly says that the Hornets should accept Cleveland's trade offer. Having Nance and Kerr in the Hornet lineup rather than Chapman could provide roughly eight additional wins per year, which would mean an instant increase to 27 wins if everyone else on the team performs at the same level as in '90. Given the youth of the Hornets, there is a good chance that there would be even greater improvement.
The problem with trade values is that they have no physical meaning and are thus a somewhat arbitrary compilation of statistics. As mentioned above, trade values are based in credits which were intended to be some representation of points, which are directly related to wins. Points are a good indication of wins, and trade values are a good representation of future credits, but credits are not a good indication of points. Credits measure how many 'things' a player does, without much distinction between good and bad 'things', rather than what he truly contributes. For example, a player can get a defensive rebound (1 credit) then dribble up the court and pass off to a player for a layup (1 assist for 1 credit, plus 2 credits for 2 points for the player who scored). This leads to 4 credits for the team (and -1 credit for the opposition on its missed shot, then a +5 net credit) when only 2 points were scored (and only +2 net points). This overestimation of points scored by credits is very common, primarily because complete offensive statistics and incomplete defensive statistics are combined arbitrarily into one formula. The use of this method has lead to some very uneven trades, most notably the Dale Ellis for Al Wood trade between the Dallas Mavericks and the Seattle SuperSonics in '86. Until management gives up this total credit-based view of players, more unfortunate misrepresentations of players will continue.
Credits = (PTS + REB + AST + STL + BLK - TO - Missed FG - Missed FT)/Game-Pace Factor
The Game Pace Factor has never been made public, which makes me hesitate to use this formula. Unfortunately, this formula probably gets the widest exposure of all. I have therefore estimated the Game-Pace Factor with
Game-Pace Factor = (TMFGA + OPPFGA + TMTO + OPPTO + 0.4(TMFTA + OPPFTA)/[2(LGFGA + LGTO + 0.4 LGFTA)]
This fairly closely fits Heeren's results, but not perfectly. The prefix TM means the player's team's stats, while OPP means the team's opponents' stats and LG means the league average for the stats.
Credits = 1.4 FG + FT + 0.85 OR + 0.5 DR + AST + STL + 1.4 BLK - 0.8 TO - 0.6 Missed FG
Credits = FG + FT + REB + AST + STL + BLK - TO - Missed FG - Missed FT
PTS: points
REB: rebounds
AST: assists
STL: steals
BLK: blocks
TO: turnovers
FGA: field goals attempted
FTA: free throws attempted
FG: field goals made
FT: free throws made
Missed FG: field goals missed = FGA - FG
Missed FT: free throws missed = FTA - FT
OR: offensive rebounds
DR: defensive rebounds